问题描述
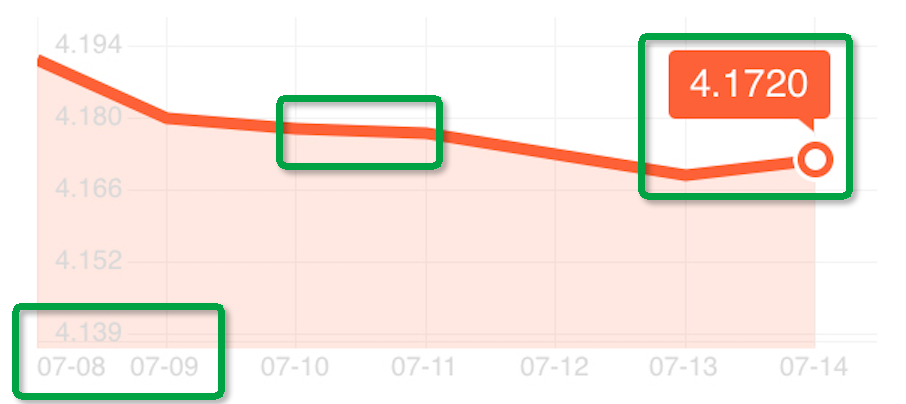
最近的android客户端中需要实现类似余额宝中的折线收益图,乍一看似乎比较简单,但还是有不少细节需要解决,所以我们还是选择了Android-GraphView做为基础来进行改造.对于基本的折线功能,Android-GraphView已经能满足,但对于折线粗细,x轴等距分布以及最后一个记录的标记提示,以及空心小圆点都需要处理,如图显示.
解决方案
首先我们需要定义好一些配置常量,由于Android-GraphView的例子并没有匹配多尺寸屏幕,使用单位px,所以我们需要统一单位dp,
|
1 2 3 4 5 6 7 8 9 10 11 12 13 |
static final public class GraphViewConfig { // 标题 下边框 间距 单位dp static final float BORDER = 34; // 数值标记 高度偏移 单位dp static final int MARKER_HEIGHT_OFFSET = 36; // 数值标记 边距 单位dp static final int MARKER_MARGIN = 5; // 圆角矩形 半径 单位dp static final int RECT_RADIUS = 3; } |
接着,我们需要处理图表内容的绘制,所以我们需要重写GraphViewContentView的onDraw方法,代码如下
|
1 2 3 4 5 6 7 8 9 10 11 12 13 14 15 16 17 18 19 20 21 22 23 24 25 26 27 28 29 30 31 32 33 34 35 36 37 38 39 40 41 42 43 44 45 46 47 48 49 50 51 52 53 54 55 56 57 58 59 60 61 62 63 64 65 66 67 68 69 70 71 72 73 74 75 76 77 78 79 80 81 82 83 84 85 86 87 |
protected void onDraw(Canvas canvas) { paint.setAntiAlias(true); // normal paint.setStrokeWidth(DensityUtil.dip2px(context, 1)); // 取得x,y轴数值以及最大,最小,差值 float border = DensityUtil.dip2px(context, GraphViewConfig.BORDER); float horstart = 0; float height = getHeight(); float width = getWidth() - DensityUtil.dip2px(context, GraphViewConfig.BORDER); double maxY = getMaxY(); double minY = getMinY(); double maxX = getMaxX(false); double minX = getMinX(false); double diffX = maxX - minX; // 计算底部高度,包含x轴标签 if (labelTextHeight == null || horLabelTextWidth == null) { paint.setTextSize(getGraphViewStyle().getTextSize()); double testX = ((getMaxX(true) - getMinX(true)) * 0.783) + getMinX(true); String testLabel = formatLabel(testX, true); paint.getTextBounds(testLabel, 0, testLabel.length(), textBounds); labelTextHeight = textBounds.height(); horLabelTextWidth = textBounds.width(); } border += labelTextHeight; // 计算图表高度 float graphheight = height - (2 * border); graphwidth = width; if (horlabels == null) { horlabels = generateHorlabels(graphwidth); } if (verlabels == null) { verlabels = generateVerlabels(graphheight); } // 画线 if (graphViewStyle.getGridStyle() != GridStyle.HORIZONTAL) { paint.setTextAlign(Align.LEFT); int vers = verlabels.length - 1; for (int i = 0; i < verlabels.length; i++) { paint.setColor(graphViewStyle.getGridColor()); float y = ((graphheight / vers) * i) + border; canvas.drawLine(horstart, y, getWidth(), y, paint); } } // x轴标签 drawHorizontalLabels(canvas, border, horstart + DensityUtil.dip2px(context, GraphViewConfig.BORDER / 2), height, horlabels, graphwidth); paint.setColor(graphViewStyle.getHorizontalLabelsColor()); paint.setTextAlign(Align.CENTER); // TODO 适应高度 border - 4 canvas.drawText(title, (graphwidth / 2) + horstart, border, paint); if (maxY == minY) { // if min/max is the same, fake it so that we can render a line if (maxY == 0) { // if both are zero, change the values to prevent division by zero maxY = 1.0d; minY = 0.0d; } else { maxY = maxY * 1.05d; minY = minY * 0.95d; } } double diffY = maxY - minY; paint.setStrokeCap(Paint.Cap.ROUND); for (int i = 0; i < graphSeries.size(); i++) { // 填充数值 drawSeries(canvas, _values(i), graphwidth, graphheight, border, minX, minY, diffX, diffY, horstart + DensityUtil.dip2px(context, GraphViewConfig.BORDER / 2), graphSeries.get(i).style); } if (showLegend) drawLegend(canvas, height, width); } |
但是这样调整之后,y轴坐标线与标签出现偏移,我们需要调整一下VerLabelsView的onDraw方法,代码如下
|
1 2 3 4 5 6 7 8 9 10 11 12 13 14 15 16 17 18 19 20 21 22 23 24 25 26 27 28 29 30 31 32 33 34 35 36 37 38 39 40 41 42 43 44 45 46 47 48 49 50 51 52 53 54 |
protected void onDraw(Canvas canvas) { // normal paint.setStrokeWidth(0); // measure bottom text if (labelTextHeight == null || verLabelTextWidth == null) { paint.setTextSize(getGraphViewStyle().getTextSize()); double testY = ((getMaxY() - getMinY()) * 0.783) + getMinY(); String testLabel = formatLabel(testY, false); paint.getTextBounds(testLabel, 0, testLabel.length(), textBounds); labelTextHeight = (textBounds.height()); verLabelTextWidth = (textBounds.width()); } if (getGraphViewStyle().getVerticalLabelsWidth() == 0 && getLayoutParams().width != verLabelTextWidth + DensityUtil.dip2px(context, GraphViewConfig.BORDER / 2)) { setLayoutParams(new LayoutParams(verLabelTextWidth + DensityUtil.dip2px(context, GraphViewConfig.BORDER / 2), LayoutParams.FILL_PARENT)); } else if (getGraphViewStyle().getVerticalLabelsWidth() != 0 && getGraphViewStyle().getVerticalLabelsWidth() != getLayoutParams().width) { setLayoutParams(new LayoutParams(getGraphViewStyle().getVerticalLabelsWidth(), LayoutParams.FILL_PARENT)); } float border = DensityUtil.dip2px(context, GraphViewConfig.BORDER); border += labelTextHeight; float height = getHeight(); float graphheight = height - (2 * border); if (verlabels == null) { verlabels = generateVerlabels(graphheight); } // vertical labels paint.setTextAlign(getGraphViewStyle().getVerticalLabelsAlign()); int labelsWidth = getWidth(); int labelsOffset = 0; if (getGraphViewStyle().getVerticalLabelsAlign() == Align.RIGHT) { labelsOffset = labelsWidth; } else if (getGraphViewStyle().getVerticalLabelsAlign() == Align.CENTER) { labelsOffset = labelsWidth / 2; } int vers = verlabels.length - 1; for (int i = 0; i < verlabels.length; i++) { float y = ((graphheight / vers) * i) + border; paint.setColor(graphViewStyle.getVerticalLabelsColor()); // TODO y轴标签对齐 canvas.drawText(verlabels[i], labelsOffset, y + DensityUtil.dip2px(context, 5), paint); } // reset paint.setTextAlign(Align.LEFT); } |
调整好了坐标以后,我们需要调整图表内容与样式了,我们需要实现LineGraphView的drawSeries方法,代码如下
|
1 2 3 4 5 6 7 8 9 10 11 12 13 14 15 16 17 18 19 20 21 22 23 24 25 26 27 28 29 30 31 32 33 34 35 36 37 38 39 40 41 42 43 44 45 46 47 48 49 50 51 52 53 54 55 56 57 58 59 60 61 62 63 64 65 66 67 68 69 70 71 72 73 74 75 76 77 78 79 80 81 82 83 84 85 86 87 88 89 90 91 92 93 94 |
public void drawSeries(Canvas canvas, GraphViewDataInterface[] values, float graphwidth, float graphheight, float border, double minX, double minY, double diffX, double diffY, float horstart, GraphViewSeriesStyle style) { // draw background double lastEndY = 0; double lastEndX = 0; // draw data paint.setStrokeWidth(style.thickness); paint.setColor(style.color); // 折线阴影部分 Path bgPath = null; if (drawBackground) { bgPath = new Path(); } lastEndY = 0; lastEndX = 0; float firstX = 0; for (int i = 0; i < values.length; i++) { double valY = values[i].getY() - minY; double ratY = valY / diffY; double y = graphheight * ratY; double valX = values[i].getX() - minX; double ratX = valX / diffX; double x = graphwidth * ratX; if (i > 0) { float startX = (float) lastEndX + (horstart + 1); float startY = (float) (border - lastEndY) + graphheight; float endX = (float) x + (horstart + 1); float endY = (float) (border - y) + graphheight; // draw data point if (drawDataPoints) { // fix: last value was not drawn. Draw here now the end values canvas.drawCircle(endX, endY, dataPointsRadius, paint); } canvas.drawLine(startX, startY, endX, endY, paint); if (bgPath != null) { if (i == 1) { firstX = startX; bgPath.moveTo(startX, startY + style.thickness); } bgPath.lineTo(endX, endY + style.thickness); } // 保存下最后一个标点 if (i == values.length - 1) { markerX = endX; markerY = endY; content = String.valueOf(values[i].getY()); } } else if (drawDataPoints) { // fix: last value not drawn as datapoint. Draw first point here, and then on every step the // end values (above) float first_X = (float) x + (horstart + 1); float first_Y = (float) (border - y) + graphheight; canvas.drawCircle(first_X, first_Y, dataPointsRadius, paint); } lastEndY = y; lastEndX = x; } if (bgPath != null) { // end / close path bgPath.lineTo((float) lastEndX + DensityUtil.dip2px(context, GraphViewConfig.BORDER / 2), graphheight + border); bgPath.lineTo(firstX, graphheight + border); bgPath.close(); canvas.drawPath(bgPath, paintBackground); } // TODO 填充色 可配置 paint.setColor(Color.rgb(250, 98, 65)); // 先绘制橙色圆 // TODO endY + style.thickness - 3 canvas.drawCircle(markerX, markerY, DensityUtil.dip2px(context, GraphViewConfig.MARKER_MARGIN), paint); // 再绘制略小白色圆 盖住橙色圆上方 paint.setColor(Color.WHITE); // TODO endY + style.thickness - 3 canvas.drawCircle(markerX, markerY, DensityUtil.dip2px(context, GraphViewConfig.RECT_RADIUS), paint); // 绘制标记 drawMarker(canvas, content, markerX, markerY + style.thickness); } |
最后完成绘制标记
|
1 2 3 4 5 6 7 8 9 10 11 12 13 14 15 16 17 18 19 20 21 22 23 24 25 26 27 28 29 30 |
private void drawMarker(Canvas canvas, String content, float x, float y) { Rect popupTextRect = new Rect(); paint.getTextBounds(content, 0, content.length(), popupTextRect); paint.setAntiAlias(true); paint.setColor(Color.rgb(250, 98, 65)); // 创建marker RectF r = new RectF(x - popupTextRect.width() * 5 / 6 - GraphViewConfig.MARKER_MARGIN, y - DensityUtil.dip2px(context, GraphViewConfig.MARKER_HEIGHT_OFFSET), x + popupTextRect.width() * 1 / 6 + DensityUtil.dip2px(context, GraphViewConfig.MARKER_MARGIN), y - DensityUtil.dip2px(context, GraphViewConfig.MARKER_HEIGHT_OFFSET / 2)); canvas.drawRoundRect(r, DensityUtil.dip2px(context, GraphViewConfig.RECT_RADIUS), DensityUtil.dip2px(context, GraphViewConfig.RECT_RADIUS), paint); Path path = new Path(); path.moveTo(x, y - DensityUtil.dip2px(context, GraphViewConfig.MARKER_HEIGHT_OFFSET / 2)); path.lineTo(x, y - DensityUtil.dip2px(context, 10)); path.lineTo(x - DensityUtil.dip2px(context, 5), y - DensityUtil.dip2px(context, GraphViewConfig.MARKER_HEIGHT_OFFSET / 2)); path.close(); canvas.drawPath(path, paint); paint.setColor(Color.WHITE); FontMetricsInt fontMetrics = paint.getFontMetricsInt(); int baseline = (int) (r.top + (r.bottom - r.top - fontMetrics.bottom + fontMetrics.top) / 2 - fontMetrics.top); paint.setTextAlign(Paint.Align.CENTER); canvas.drawText(content, r.centerX(), baseline, paint); } |
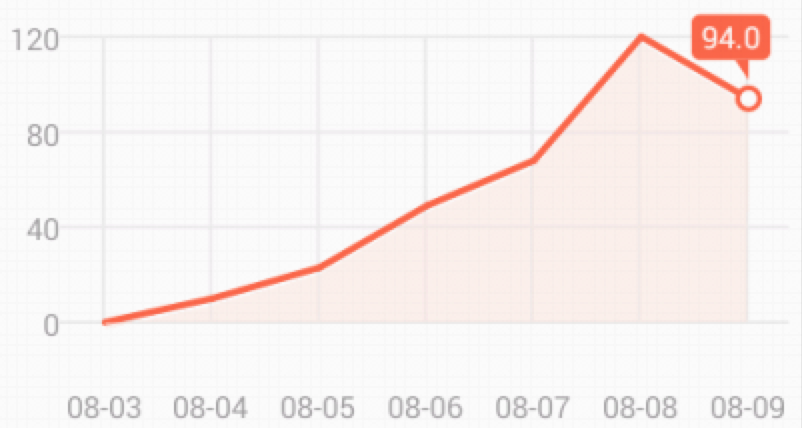
这样整个调整就完成了,我们可以写出一个DEMO做测试,我们直接看下效果图,完整代码请在此下载

霸气外露。
很实用!项目中正好要用到,先收藏了~
请问侧面的数字怎么能多加几位啊 位数多了空间不够